"My rule was I wouldn't recruit a kid if he had grass in front of his house.
That's not my world. My world was a cracked sidewalk." —Al McGuire

Wednesday, February 26, 2020

We're in Lenten Season, Patience is the Order of the Day.

I'm BAAAACCCCCKKKKKK

Don't panic, this blog post shouldn't be as long as the previous one. It'll be ramble-ly to be sure but I think we can get to the point more rapidly. First, the feedback and commentary from the first post was tremendous and I truly appreciate the support because this isn't really my thing. Second, I'd like to highlight a tweet I got from someone on Twitter.


A bit of a side commentary(oh boy, I've really got a case of the rambles), Rubie Q is my favorite Wojo hater on Twitter. He is thoughtful, informed, very snarky, and not a dick. The lesson, push back all you want but don't be a dick.

Any whosie, this tweet hit home because I had this concern when I was doing my analysis. I was leaving out any analysis of whether other not Wojo-led teams are competitive in the general sense not just in the close game sense. Rubie is spot on, one of the "yeah, buts" of the Wojo era has been that he gets blown out in games and I didn't address it. So now I've got to go back to the ole' hypothesis drawing board. The good news, I think the work previously done is still valid but I have an additional hypothesis to test. So what is that hypothesis?

Hypothesis: Wojo-led teams have more non-competitive games lost than the average coach.

OK, big breath.....how the hell do I figure out THAT data set?? Paint Touches rode in with a suggestion (and a very good one) to use the T-Rank website (wonderful website I suggest you visit, it's like KenPom with a two drink minimum and free) which has a +/- metric which basically breaks down as the average margin for each game that the team had. So a -10 in the +/- metric means the team in question was losing on average by 10 through out the game, and when you combine that with a win in that game it would tell you that was a furious come-back win versus something like a +2 result with a win which might tell you it was a dog fight through out. The only flaw in this approach is that the T-Rank data does not cover the full extent of my control group because it doesn't go back that far, plus it would enable/force a different classification system than I originally started out with. I think this approach has a lot of merit going forward but seems like it's an analysis with a slightly different hypothesis to test(definitely something I'll consider as a future article if they don't take the keys to this website away from me). So back to the drawing board, I guess. Now, it's important to remember I'm lazy so I thought about the data I already had and it struck me, if I had every game for the teams I am analyzing I already have the hard analysis done....I know what games were competitive! Ergo, by definition any games that weren't in the list were non-competitive (ie a blow out win or loss). To that end, with a little more information collection I was able to grab the full season results for the Wojo-seasons plus the control group and classify each game in one of four categories: Non-competitive loss, Competitive loss, Competitive win, and Non-competitive win. So with that, we arrive at our first visual.


Lot of numbers, rows and lines....not much to take away from this view alone though it is interesting to note that the control group average for non-competitive losses a season is 3.5. Considering the control group has some very well regarded coaches and a couple of national championship winning teams it seemed a little high to me. So let's look at that information with with some context, I want my loses to be low in number(especially non-competitive) and my wins to be high in number(especially non-competitive) so let's apply some conditional formatting and voila:


As we already knew from the previous article I bored you with, Wojo has been getting steadily better in competitive games but it also appears that he is getting better about not having non-competitive losses. He is certainly not at an elite level in that regard (knock me over with a feather) but he isn't the garbage results he was in the first couple of years at Marquette. We should also acknowledge that he is not good at blowing other teams out so Wojo is generally going to win but not that convincingly. This years team has at least 6 games left to play, I'd expect MU to win the majority left but to do so in a non-blow out fashion, that's a good thing (maybe we aren't collapsing, who knows). However, I wanted to apply another bit of analysis to this....it's easy to not get blown out when you are playing "easy" teams, so let's apply the KenPom rankings to this


The analysis is simple here, Wojo's Achilles heal is that if he doesn't beat an elite team he gets blown out by them....but that's true of most of the coaches. Put another way, it seems like Wojo is probably a good coach(or above average considering the control group) but hasn't yet figured out how to beat the elite teams consistently and/or be really competitive in those games. However.....here's where I use that pesky trend term again.....Wojo's results have been trending upwards with each season. Wojo is getting more competitive against sterner competition as he has gone on. He's definitely not where we want him to be, but if the trend holds, he'll get there in the next couple of seasons. OK, but wait there's more! I then took all this data I now have and wanted to look at it in a weighted quad fashion (which does a good job of reflecting game location and team rank) to see if there was anything that stood out there. Long story short, each category type got a rating of 1 through 4 (1 being non-competitive loss and 4 being non-competitive win) and I multiplied the number of games in each category based on the weight then categorized them by the quad type and this is the visual you get.


Some housekeeping, the brown toned bars are the control group while the blue toned ones are the MU teams under Wojo. The red bars represent the average value of the control group metric in each quad. One really important thing to keep in mind when looking at this chart.....this years team has at least 6 more games to play this season and they are all going to be Quad 1 or 2 games so the darkest blue bar in the Quad 1 and 2 graph is going to get higher no matter what. Two major take-aways by looking at the data this way: Wojo's team this year is performing about where the non-national championship coaches of the control group performed in their seasons and that pesky trend is aiming positively again.

The conclusion from all of this is, once again, I think Wojo is victim of some narrative forming early in his career at MU that he simply hasn't been able to eliminate and as a consequence the "bad losses" result in more of the "here we go again" response as opposed to being able to reflect on those types of games becoming fewer. In other words, it feels like Wojo is performing as bad as ever, but he's actually getting better. I don't think he is where we want him to be, but this review gives me hope that he can get to where we want him to be. Will he? Very tough to say, but I don't have any evidence that he can't at this point which I will take and run with.

One more piece of context I want to provide as part of this analysis is a bit of commentary on expectations. In a very lucky happenstance, Alan Bykowski (he's the one that does all the good work on Cracked Sidewalks and the lead acolyte in the Howard for NPOY campaign), collected data on all of the coaches that have been to a Final Four in the last 20 years (41 coaches in total). He has data on how long it took the coach to first achieve an NCAA bid, how many seasons it took to reach both a Final Four and(if relevant) a National Championship, as well as how many coaching jobs before they achieved those goals. Below is the list of 41 coaches and the cells colored green are those coaches that have achieve one of the goals faster than Wojo has to date, ie. if a coach got to a Final Four in 5 years or less the cell is green because Wojo definitely hasn't done that (otherwise I wouldn't have to write an article like this)


Puts it in a little perspective, for me any ways. Yes, we are leaving out that Wojo hasn't won an NCAA game nor reached something more achievable like a Sweet Sixteen berth(which are totally reasonable expectations) but there are also a lot of coaches that went on to make a Final Four who didn't even appear in an NCAA game in their third season. Further, the average length in role to make a Final Four is just over 11 years! I'd also like to look at this list in one more way, what does the list look like if we apply these filters: coaches who made an NCAA bid in 3 years or less, made a Final Four, and did all of that in their first head coaching gig:


That's it, that's the list. Three of the five guys on the list (of the last 20 years) went to the Final Four on the backs of other coaches players and never found success anywhere else again. A fourth is struggling in his second gig (#DoneDeal) and the fifth is Brad Stevens who left for the NBA where he is clearly proving to be a very, very good coach. I don't offer this up as some sort of full-throated rebuttle to the concerns over Wojo....it is definitely concerning that he hasn't won an NCAA tournament game and that he hasn't yet found a way to beat elite teams. We also might be in the midst of another late season collapse which would be a huge red flag. What I do offer this up as is food for thought....do we need to be reactionary here or do we play the long game and see where it plays out? I think the expectation should be to win an NCAA tournament this year and earn a Sweet Sixteen berth within three years, and if he doesn't meet those expectations we gotta think about moving on. In the interim, the data tells me #mubb has a coach who is improving and showing little to no signs of having hit his ceiling yet. That's good enough for me anyway.

Tuesday, February 25, 2020

We're panicked, but we're not that panicked....yet

Things have taken a decided turn once again for your favorite college basketball heros. #mubb finds itself in the midst of a 3 game losing screen with last seasons late collapse of a 6 game losing streak hovering over it. So we have to talk about the disappointing results this week and break down what went wrong. We then discuss the sobering realization that this season may be Wojo's best shot at an NCAA win in his first seven seasons.We then discuss whether this is actually a collapse we're going through or just a tough stretch of games. Lastly we talk about the two games this week and just how desperate we've become to just beat Georgetown. Enjoy! https://scrambledeggs.podbean.com/mf/play/m4kch2/scrambledeggs_edit_022420.mp3

Mid-Major Madness?

Nothing seems to get people debating more consistently about college basketball than the definition of mid-major. For the purposes of this article, I'm going to make it simple: any league outside the top-7. That includes the traditional football powers (ACC, Big 10, Big 12, Pac 12, SEC) and the two leagues formed by the 2014 Big East fracture (American, Big East). Since that break, all of those leagues have averaged over 3 bids per year and sent multiple teams to the NCAA Tournament every season.

Leagues with a chance of placing multiple teams but not fitting the above power structure are mid-majors, regardless of individual program ability. Gonzaga, San Diego State, and Dayton are national title contenders but the leagues they come from are definitionally mid-majors. The above three are locks, so we'll discuss the rest of the teams hunting at-large bids from those mid-majors.

To start, let's look back at the resumes from last year of mid-majors that both made the field and missed out. The teams in green were included, the teams in red were in the NIT:


Team NET Record Comp Avg SOS Q1 Q2 Q3 Q4
Nevada 23 29-4 24.8 116 1-1 7-2 11-2 10-0
VCU 34 25-7 39.4 53 2-2 3-2 9-3 11-0
Furman 41 22-7 65.0 189 1-5 3-1 2-1 16-0
Belmont 47 25-5 52.2 195 2-2 3-1 3-2 17-0
Lipscomb 49 23-7 53.8 212 2-3 2-3 2-1 17-0
UNC-Greensboro 60 26-6 68.6 103 2-6 2-0 7-0 15-0

What do we learn from the above? The three teams that made the field all had a record above .500 in Q1+2 games. Even though they had more losses outside the first two quadrants than any of the teams left out, they were included seemingly because of strong Q1+2 performance and strong computer numbers. Furman was the highest team left out, but had a losing Q1+2 record and their computer average was one of the worst. Bottom line, you can have some bad losses, but you better show you can compete in your toughest games if you want to get in. Let's look at the 2020 resumes:


Team NET Record Comp Avg SOS Q1 Q2 Q3 Q4
BYU 14 22-7 27.4 28 3-4 4-3 8-0 7-0
St. Mary's 32 22-6 37.4 82 3-3 4-1 6-2 9-0
Rhode Island 37 19-7 41.8 54 1-4 5-2 7-1 6-0
Utah State 38 20-7 42.8 101 2-4 2-2 6-1 10-0
ETSU 39 22-4 46.6 149 2-1 1-1 7-1 12-1
Northern Iowa 46 21-5 54.2 98 1-1 4-2 9-2 7-0
Richmond 49 20-7 48.6 78 2-4 2-2 6-1 10-0
Liberty 50 24-3 67.2 298 0-1 1-0 3-1 20-1
UNC-Greensboro 62 21-6 58.6 146 1-2 2-2 6-1 12-1
Stephen F Austin 87 21-3 100.2 342 1-2 0-0 2-0 18-1

BYU: At this point, the Cougars are a lock. Any doubt was removed when they beat Gonzaga. Their remaining schedule includes a Quadrant 2 game at Pepperdine and the West Coast Conference Tournament. Nothing there would damage them enough to take them out of the field. While their Q1+2 record is just 7-7, the quality of wins and computer numbers are simply too good to leave them out.

St. Mary's: The Gaels are close to sealing a three-bid WCC, but aren't there yet. They still have a Q3 game at Santa Clara before their season-ending showdown at Gonzaga. As we saw last year, the Selection Committee will accept multiple Q3 losses if you have a winning Q1+2 record, which the Gaels do.

Rhode Island: The Atlantic 10 has been regularly getting multiple bids, but last year only got a second bid because St. Louis won the A-10 tournament. It's a far cry from the 6 bids they landed in 2014. The Rams' loss at Davidson hurt because it was their strong Q2 record propping up shaky Q1 numbers. The Rams resume looks a lot like VCU's last year, but I definitely think they need to keep that Q1+2 record at .500 or better if they want to get in.

Utah State: The Aggies' case is helped significantly by those two wins over SEC teams at the top of their resume. This team really unnerves me because their Quadrant numbers look a lot like the resumes that got left out last year. The losses aren't terrible, but I'm not sure the Q1+2 record is good enough to offset it. For now, we have them in, but my confidence level in Utah State is not high.

East Tennessee State: This is where we get to full-on mid-major territory. No one that made last year's field had a Q4 loss like the Buccaneers, but they check all the other inclusion boxes. Strong computer numbers, winning Q1+2 record, and they have a Q1A win at LSU. What will be interesting is if North Dakota State, who they lost to on the road, is able to improve to a Q2 loss and whether that helps or hurts ETSU. While it would be a better loss, it would take their winning Q1+2 record to .500 and I'm not sure that works in their favor when the Selection Committee has shown in the past a willingness to look past Q3 losses if you have a winning Q1+2 record. That said, the cutoff for a Q2 road win is NET 135, and ETSU has three games that are a whisker away from qualifying: NDSU at 136 (L), Little Rock at 138 (W), and Western Carolina at 140 (W). I think the best case scenario for them is if UALR and WCU get to the top-135 while NDSU stays right where they're at.

Northern Iowa: I really like their chances at this point. Their profile looks very similar to last year's Belmont team. As long as they don't take any bad losses (one remaining game in Q3 & Q4 each) they should be able to get in even if they don't win Arch Madness.

Richmond: The Spiders remind me of last year's Lipscomb. Not a ton of bad, but not enough good to bolster their chances. If they win out, the overall weakness of the bubble will give them a chance (1 Q2, 3 Q3 games remaining) but this team's resume does not inspire confidence.

Liberty: They're like last year's Lipscomb, only worse. When your entire resume is essentially one Quadrant 2 win over Akron, I don't see an at-large. The Flames will be favored in the Atlantic Sun Tournament, but if they don't win, I expect them to get left out. There's just no real substance to offset the reality that 83% of their wins are Q4 games.

UNC-Greensboro: I felt the Spartans were one of the biggest snubs last year due to having zero losses outside Q1. If 4-6 a year ago wasn't good enough despite zero sub-Q1 losses, 3-4 with two sub-Q1 losses and only marginally better computer numbers doesn't seem like it will be good enough either. This is a team that likely needs to win the auto-bid, which would make a 2-bid SoCon more likely due to ETSU's stronger resume.

Stephen F Austin: The conversation that started this was Ken Pomeroy defending SFA as an at-large team on Twitter. This is largely predicated on their overwhelming record and the Strength of Record metric. SOR is one of the computer rankings used by the Selection Committee and has the Lumberjacks ranked 48th. While I get the argument, the reality is SOR is just one of the computer numbers and the rest overwhelmingly hurt the 'Jacks case. The Duke win was one of the moments of the season, but there just isn't enough in the rest of the resume to justify an at-large bid, especially when teams that do have more substance, both in terms of raw resume and computer numbers have similar or better SOR scores (Utah State 42, Northern Iowa 43, Richmond 44, UNCG 49). If the Selection Committee is looking to add mid-majors, SFA simply doesn't have the overall substance to the resume. Essentially, they would be included because of a turnover in overtime. If Duke scores on their final possession instead of turning it over, this isn't even a discussion point. One fortuitous possession is simply not enough to warrant at-large inclusion that will come not just at the expense of stronger high-major resumes, but stronger resumes on this list.

Let's dig into the full S-Curve:

1-Seeds: 1-KANSAS 2-Baylor 3-GONZAGA 4-SAN DIEGO STATE
2-Seeds: 8-Creighton 7-Duke 6-MARYLAND 5-DAYTON
3-Seeds: 9-Villanova 10-FLORIDA STATE 11-SETON HALL 12-KENTUCKY
4-Seeds: 16-Michigan 17-Auburn 18-Oregon 19-Louisville
5-Seeds: 17-Iowa 18-Michigan State 19-Butler 20-Penn State
6-Seeds: 24-Marquette 23-Byu 22-West Virginia 21-Ohio State
7-Seeds: 25-Wisconsin 26-Illinois 27-Colorado 28-Texas Tech
8-Seeds: 32-Houston 31-ARIZONA STATE 30-Lsu 29-Arizona
9-Seeds: 33-St. Mary's 34-Xavier 35-Florida 36-Virginia
10-Seeds: 40-Indiana 39-Rutgers 38-Rhode Island 37-Wichita State
11-Seeds: 41-EAST TENNESSEE STATE 42-NORTHERN IOWA 43-Georgetown 44-Stanford/45-Utah State
12-Seeds: 50-VERMONT 49-YALE 48-CINCINNATI 47-Usc/46-Providence
13-Seeds: 51-LIBERTY 52-AKRON 53-STEPHEN F AUSTIN 54-NORTH TEXAS
14-Seeds: 58-COLGATE 57-HOFSTRA 56-NEW MEXICO STATE 55-WRIGHT STATE
15-Seeds: 59-UC IRVINE 60-LITTLE ROCK 61-AUSTIN PEAY 62-SOUTH DAKOTA STATE
16-Seeds: 68-NORTH CAROLINA A&T/67-ST. FRANCIS (PA) 66-PVAMU/65-ST. PETER'S 64-RADFORD 63-MONTANA

Last Four Byes: Rhode Island, Rutgers, Indiana, Georgetown
Last Four In: Stanford, Utah State, Providence, USC

NIT 1-Seeds: Oklahoma, NC State, Richmond, UNC-Greensboro
NIT 2-Seeds: Memphis, Arkansas, Alabama, Mississippi State

Multibid Leagues
Big 10: 10
Big East: 8
Pac 12: 6
ACC: 4
Big 12: 4
SEC: 4
American: 3
WCC: 3
Atlantic 10: 2
Mountain West: 2

Monday, February 24, 2020

The Grand Unified Theory of Wojo……or why I learned to stop worrying and love the chaos

Before we get too far into this blog post you should know some things about me: I am an engineer by education, I know a little bit about a lot of things, I have two kids under five, I believe in a rich tapestry of pop culture references that would make Bill Simmons say uncle, and in college, a roommate once said about me “it’s almost like you can physically see the trains of thought collide in his brain”. Why do I tell you all this? Mostly so you are prepared for the poorly written stream of consciousness blog article you are about to inflict on yourself; also know that if I’m taking time to do this is matters cause….kids are a lot of work and I’m inherently lazy.

So over the last couple of weeks, there has been a lot of noise about the current head coach of Marquette University’s men’s basketball team (I had no idea where to put the apostrophe(s) so this is a great start) Steve Wojciechowski. Over the first five seasons of his tenure, the general fan attitude of Coach Wojo (that’ll save me some letters) was always seemingly “he’s fine but…..” or “he can really recruit but…..” and the but is always followed up with a list of complaints five or six deep. Things like “Wojo can’t adjust” or “Wojo just rolls the ball out for Markus and sees what happens” or “unless he has a powerpoint for it, Wojo can’t solve it”. You get the idea. It’s not flattering.

Well, this season the “yeah, buts” have gotten, we’ll say, more vocal and the disdain for Wojo has gone from the retched hives of scum and villainy that is Twitter and message board forums to out loud in person booing. Certainly concern has been warranted given some fairly spectacular screw ups in the current season. First there was the way Wojo handled the last 6 minutes of a winnable game against Providence, but then two weeks later he completely forgot the score in a tie game and ordered his team to foul with 15 seconds left. It was just dumb and given all the “yeah, buts” that people already had with Wojo, it clearly broke a dam. In all the teeth gnashing, booing, complaining, and otherwise general panic within the fanbase I spent some time trying to defend the Wojo era, in large part because I tend to be a pretty optimistic person and I really don’t want to go through another exhausting coaching change. So I would post things things about how particular times he made adjustments in games or cite outstanding articles like this one from Paint Touches which shows Wojo’s After Time Outs (ATO) plays are spectacular. However, it never seemed to convince anyone other than those who were already convinced, so I started to think perhaps I was wrong and my optimism was pointing me in the wrong direction. It’s true that Wojo seems to make adjustments and his ATO plays are good, but then there are the blow out losses to good teams and the perception that Wojo just can’t win games when it matters. This last thought stuck with me: does Wojo really not win in the clutch? Is it possible that Wojo can coach for the most part but when it matters, with the blood pumping in his ears and moments left on the clock, does he fall apart? That’s when the engineering part of my brain kicked in(see, the rambling preamble had a point) and said “ya know what that question is? That’s a hypothesis.” So that’s the point of this post, the journey I start on to determine if Wojo is a clutch coach with the hope that if I could answer that I might be able to settle the question of whether he was a good coach or not.

For those of you who aren’t familiar with statistical analysis (Why would you be? It’s very boring) you always have to start with a hypothesis. Basically a statement of something you believe to be true and then you use data to try and validate the statement is true…..if you can’t then it’s likely false. So let’s start there:

Hypothesis: Wojo is not a clutch coach

OK, cool so now I just need to test that against some data and I can kick back and bask in the glory of the six nerds who will actually want to read about it. Let me go find that data…………….yeah, so it doesn’t exist. Guess I’m going to have to tell #noredforOwen to go spend some more time building puzzles by himself, I’ve got a data problem. So to solve the data problem I had to figure out what data I needed to validate whether Wojo was clutch. I had to figure out what games would show whether Wojo was clutch and decided that “close” games and their result would suffice for my data set so let’s go figure out some close games. I settled on a highly sophisticated and calibrated algorithm of, well, looking at KenPom game summaries and applying some rules of thumb which would classify whether a game was close or not. Those rules of thumb are as follows:

-if a game goes to OT, it’s close (really stressing the ole’ brain on this stuff)
-if a game is within 5 points either way with 5 minutes to go, it’s close
-if a game is within 3 points either way with 1 minute to go, it’s close
-if the win probability flips from one to the other or is around 50/50 with 5 minutes or less to go, it’s close
-if the final score is within one possession, it’s close

With those rules in place, I determined that there have been 84 games in the Wojo era classified as close. For context, there have been 189 games in the Wojo era which means 44.4% of Wojo’s games have been close. Neat, what does that tell me? Shrug emoji. That could be great, could be bad, could be average. So here’s where we get deeper into the statistical nerdery….I started by gathering a data set on Wojo, but I need a control group. I need the same data set but on other coaches to give me some sort of indicator as to where Wojo falls in the continuum of clutch. So I did what any lazy person does, I crowd sourced via Twitter DOT com. I asked the internet what seasons or what coaches they thought were clutch and boy did you guys deliver. Here is the list of Teams – Coaches (Season Year) that I decided to make a part of my control group:

Marquette – Buzz Williams (2013)
UConn – Jim Calhoun (2011)
Maryland – Mark Turgeon (2016)
Wisconsin – Bo Ryan (2015)
Butler – Brad Stevens (2013)
Michigan State – Tom Izzo (2016)
Villanova – Jay Wright (2016)
Virginia – Tony Bennett (2016)

Some brief (yeah, right) commentary on the control group. This is somewhat of an arbitrary control group that is focused on teams in the last 10 years (peak KenPom data set) and it is by no means exhaustive. It does have a lot of coaches in it that the general public would say, yes they are a great coach so it feels like a solid control group. As people suggest more “clutch” teams they can be added to the data set, but this is what we have to roll with now. The control group has 108 close games out of 300 games played giving an control average of 36%, meaning we have our first comparison….Wojo has played more close games then our control group on average. However, lets dive deeper as I gathered a lot more information than just close or not close (if that was all I had this would be a short and boring article instead of a just boring one). For each close game I collected details about the game like Home/Away/Neutral, KenPom rank of opponent, and then used those attributes to assign a quad classification as defined in the Net Rankings (yes it’s a mixing of concepts but Net rankings are produced by dark elfin magic for all I know but the Quad format makes a lot of sense). I’m using the Quad format as a metric of game quality, ie a Quad 1 win is a better quality win than a Quad 4 win. So with all that, we come to our first data visual


A couple of things jump out just by looking at this table. Holy salmon on an iced cracker, that UConn 2011 team must have killed a lot of its fans! Generally speaking the new old Big East (or is it the old new Big East) was RIDICULOUS and something like it will never be seen again. Second, this season has had a lot of close games already and we’ve got four to go…buckle up!

So let’s break down the quads and see if anything jumps out for Wojo


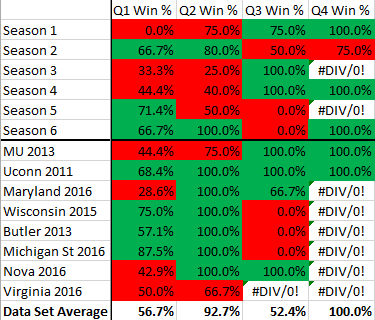
First, red cells indicate the result is below the control average in each quad while green means above that average. The first thing that jumps out at me is that the coaches in the control, by and large win the games you are supposed to(Q2 and below). Buzz’s numbers might be a little misleading because again the old new Big East was insane so while he lost more than half of his Q1 games, he had a lot of them. What also stands out to me is the almost linear progression of Wojo’s performance in the Q1/Q2 games. This is a clear indication to me that the complaints about Wojo’s ability to win close games was warranted but he has steadily improved on that culminating in an outstanding performance to date this season. We can’t throw a ticker tape parade for him on this data alone as we don’t know if this improvement is because of better coaching or better players, though both would be directly impacted by Wojo’s tenure. Either way, we’ve got something useful out of this (YAY!), so let’s press on.

We’ve got some evidence that Wojo has been getting better at winning tough games that are tight but how many tight games are happening/should happen? I’ve got a graphic for that.


The first column is a calculation of how many games the team played that have been tight, theoretically you want this percentage as small as possible (assuming you have a good record) because then you are winning even tough games handily. Looking at the control group, other than essentially the super good old new Big East teams, good teams have a relatively low percentage of tight games they play. Conversely, Wojo’s teams have seemed to have a good amount of tight games, especially this season. That’s a strike against Wojo to be sure, but there is some context. Look at the Schedule Strength column, MU this season has faced very high level of competition in the tight games so playing good teams tight isn’t necessarily a bad thing especially when you combine it with the fact that Wojo is by and large winning those games. Very notable is the middle column, Wojo this season to date has been outstanding at winning close games. Yes the Butler and Providence games stick out in a very negative way, but other than those two games, Wojo is getting the job done. One of the reasonable conclusions is that Wojo is getting on the job training and it seems he is applying those lessons this season. One note on the last column, this is a made up metric (by my crazy brain) but it basically is a weighted score of tight games (translation a tight Q1 game is weighted more than a Q2 one, etc). What the metric does a good job of showing is A) I’m super duper glad I wasn’t a UConn fan in 2011 (though they won it all so I guess it worked out) and B) I hope all MU fans have seen a cardiologist at some point this season cause the ol’ ticker is getting a work out C) that generally Wojo’s teams have been playing tighter games at higher levels than most high quality teams historically which tells me that Marquette isn’t an elite team right now (when you’re done picking yourself up off the floor from shock please keep reading).

Let’s look at this another way, let’s compare the amount of winning in tight games to the difficulty of the opponent:


(Note: Red lines represent the control group average) The take away? MU as a team is continuing to improve in the Wojo era, but they also we pretty bad originally. One note, if not for the collapse at the end of the season last year (all late losses against almost all Q1 opponents) MU would have been approaching elite status last season (no more letter writing campaigns, m’kay?).

For me a picture is starting to form, that Wojo theory is coming into range (we’ll get to the title at the end), but I was troubled by one other thing. Going back to the Paint Touches well, there was concern about MU not being able to win away from home (namely they are 1-25 against KP Top 25 teams in the Wojo era), which is a problem. Winning on the road/neutral sites is the cornerstone of good coaching, without it the tournament is going be a hot mess. So that’s what this next chart is, how Wojo (and the control group) did in winning tight games at home versus in general


The long and the short of it is you want to be as high as possible on the chart and as far to the left as possible…anything in the upper left is elite level coaching (god I hate Bo Ryan showing up here). Both the raw data and the graphic show that the Wojo era has shown growth here. He definitely still seems to have too much dependency on the home court in close games (ie close games on the road are more likely to fold than not) BUT it is getting better.


Let’s close this out and get back to the whole point of this post. In physics (again the opening paragraph matters  ), there are four interactions that define how the universe works – electromagnetic, gravitational, weak, and strong, and these interactions have their own theorems and laws. However, physicists have been trying for decades to unite these interactions into a single theory in which they all are interrelated, or a Grand Unified Field Theory (Einstein famously tried and failed to unify his general relativity model with electromagnetism). Well, taking that as inspiration, and using the research of others as well as what you’ve seen in this blog post, I’ve created a Grand Unified Theory of Wojo, one that unites all of the concepts, complaints, and concerns that exist within the #mubb galaxy brain…..are you ready?

Wojo is a decent coach, good molder of men, and great recruiter who is learning on the job and showing improvement. That’s it, that’s the theory. Every indicator is that Wojo was average to below average early in his career and has gotten better. Take this stat collected from poster Frenns Liquor Depot on MUScoop.com (yeah I know, but remember I’m lazy so here we are), Wojo’s record against KenPom Top 25 teams:

2015: 0-12
2016: 0-6
2017: 1-6
2018: 0-10
2019: 4-1
2020: 2-5 (with 1 top 25 team to go)

Certainly not a ringing endorsement but it’s the trend line that matters. Also keep in mind that Top 25 teams are Top 25 teams because they are hard to beat. We can argue all we want about Wojo’s mistakes, his failures, and his lack of public persona but what I don’t think we can argue is that Wojo is getting better every year as a coach. I have no doubt that some of that is due to improving talent on the roster, but if Wojo isn’t responsible for that I don’t know who is. Further evidence of that is this very recent article from Anonymous Eagle. It is clear that the team is not yet elite and certainly has warts, but we may be getting fewer warts each successive season. It’s also clear that Wojo is learning to win the tight games that he wasn’t winning early in his career. Keep in mind that Wojo has A) never been a head coach previously and B) where he was the lead assistant his teams almost always had the talent edge over opponents. Simply put, Wojo hasn’t had to “coach hard” until he got to Marquette. I think the narrative of Wojo being a bad coach (generally people view him as a good to great recruiter) got set early with some teams that had considerably less talent than fans had become accustomed and that narrative has been hard for Wojo to shake.

What I am ultimately saying here is that the chaos we all perceive is the symptom of a coach learning what it takes to win every day in one of the best conferences in the country. The Chris Beards or even Buzz Williames of the college basketball world are by far the exception. Tom Izzo wasn’t Tom Izzo until he was, same with Jay Wright or Tony Bennett. Sometimes these things take time and sometimes we have to give people the space to learn and grow. Wojo has demonstrated he is growing and I see no reason to believe he won’t continue to grow. I get the frustration of the two steps forward, one step back cadence to the Wojo era, but one of these days I think we’ll see steps forward with very little steps back. All of these lessons learned may pay off as soon as this season in the tournament where winning tight games is what it is all about. If Wojo can make a run in March, riding the nuke all the way in will have been worth it.

Friday, February 21, 2020

Are 8 Big East Bids Possible?

At Christmas, we surmised about the possibility of the Big East setting a record for the highest percentage of teams to make the field, potentially surpassing the 77.8% of teams (7/9) that made the NCAA field from the Big East in 1991. At the time, we projected 9 teams in the field, but that was before league play started.

As usually happens to strong leagues, strong non-con resumes fall by the wayside as leagues cannibalize themselves. That happened to St. John's, who went from 11-2 in non league with two brilliant Quadrant 1A wins over West Virginia and Arizona to 3-10 in league. Two of those Johnnie wins came over DePaul, who were 12-1 in non-con before a miserable 1-12 start to league play and having a Big East Tournament title be their only route into the field of 68.

The one team that we had out in that Christmas projection was Providence, who has gone the opposite direction. While we don't have them in yet, it's a big yet as the Friars now have as many or more Quadrant 1 wins than 11 of the top-16 teams in the field. They did a ton of damage to their resume in November, but if the Selection Committee continues to value good wins over bad losses, Providence will have a chance. Let's take a look at the resumes of teams on the bubble:


Team NET Record Q1 Q2 Q3 Q4
Xavier 40 17-9 3-8 6-1 4-0 4-0
Georgetown 54 15-11 5-9 4-2 1-0 5-0
Indiana 59 17-9 5-7 2-2 4-0 6-0
Richmond 43 20-6 2-4 2-0 6-2 10-0
Utah State 41 20-7 2-4 2-2 6-1 10-0
Stanford 37 17-9 3-5 2-3 5-1 7-0
Arkansas 48 16-10 2-6 2-4 8-0 4-0
NC State 52 17-9 5-2 3-4 3-3 6-0
Providence 51 15-12 6-8 2-0 3-3 4-1
UNCG 60 20-6 2-2 1-2 5-1 12-1
Cincinnati 55 17-9 2-5 6-0 6-4 3-0
Alabama 44 14-12 2-6 4-4 5-2 3-0

First, I only included Xavier and Georgetown to show the difference between them and current bubble teams. Xavier is clearly ahead and likely needs just two more wins to move to lock status. Georgetown has a little more work to do, especially with a tougher schedule, and needs to go 3-2 the rest of the way to be assured a bid before heading to MSG.

Currently Stanford is our last team in. While Providence is back a little bit, they have more Quadrant 1 wins than anyone else on the bubble. Their losses look bad, but their 4 total losses outside Quadrant 1 are less than or equal to six of the 12 teams here. Considering how frequently bubble teams are taking losses, the Friars definitely have a shot. Let's compare them to some teams that made it into the field last year:


Team NET Record Q1 Q2 Q3 Q4
Florida '19 31 19-15 4-12 4-1 6-2 5-0
St. Mary's '19 32 22-11 2-6 3-3 8-2 9-0
Providence '20 51 15-12 6-8 2-0 3-3 4-1
Ohio State '19 55 19-14 4-10 5-3 5-1 5-0
Seton Hall '19 57 20-13 7-8 7-3 3-2 3-0
Arizona State '19 63 22-10 3-3 8-3 5-2 6-2
St. John's '19 73 21-12 5-7 5-3 3-2 8-0

Remember, all of the 2019 teams above were IN the field of 68. That was in a year with a stronger bubble than this year. Providence's NET is above average, their Quadrant 1 win total is higher than all but one of these teams. In fact, only one team last year (Indiana) was left out of the field with 6+ Quadrant 1 wins. Indiana's biggest flaw was their 17-15 overall record and 6 losses outside Quadrant 1. While Providence does have a number of Quadrant 3+4 losses it is no more than Arizona State and their loss total outside Quadrant 1 is equal to or lower than 5 of the 6 teams they are being compared to that made last year's field.

While it's still not likely--my gut tells me that six teams is more likely than eight at this point--it isn't impossible that the Big East could land a record 80% of their teams in the field this year, and the last team to get in would be the one team we wrote off for dead before the New Year.

Here's the full S-Curve:

1-Seeds: 1-BAYLOR 2-Kansas 3-GONZAGA 4-SAN DIEGO STATE
2-Seeds: 8-Creighton 7-Duke 6-DAYTON 5-MARYLAND
3-Seeds: 9-Villanova 10-SETON HALL 11-Florida State 12-LOUISVILLE
4-Seeds: 16-Auburn 15-West Virginia 14-Oregon 13-KENTUCKY
5-Seeds: 17-Penn State 18-Butler 19-Michigan 20-Marquette
6-Seeds: 24-Arizona 23-Michigan State 22-Iowa 21-COLORADO
7-Seeds: 25-Ohio State 26-Wisconsin 27-Byu 28-Illinois
8-Seeds: 32-Texas Tech 31-HOUSTON 30-Xavier 29-Lsu
9-Seeds: 33-Arizona State 34-Rhode Island 35-Rutgers 36-Wichita State
10-Seeds: 40-Florida 39-St. Mary's 38-Usc 37-Georgetown
11-Seeds: 41-Virginia 42-Oklahoma 43-EAST TENNESSEE STATE 44-Indiana/45-Richmond
12-Seeds: 50-VERMONT 49-YALE 48-NORTHERN IOWA 47-Stanford/46-Utah State
13-Seeds: 51-LIBERTY 52-AKRON 53-STEPHEN F AUSTIN 54-NORTH TEXAS
14-Seeds: 58-COLGATE 57-HOFSTRA 56-NEW MEXICO STATE 55-WRIGHT STATE
15-Seeds: 59-UC IRVINE 60-LITTLE ROCK 61-AUSTIN PEAY 62-SOUTH DAKOTA STATE
16-Seeds: 68-NORFOLK STATE/67-ST. FRANCIS (PA) 66-PVAMU/65-SIENA 64-RADFORD 63-MONTANA

Last Four Byes: St. Mary's, Florida, Virginia, Oklahoma
Last Four In: Indiana, Richmond, Utah State, Stanford

NIT 1-Seeds: Arkansas, NC State, Providence, UNC-Greensboro
NIT 2-Seeds: Cincinnati, Alabama, Mississippi State, Purdue

Multibid Leagues
Big 10: 10
Big East: 7
Pac 12: 6
Big 12: 5
SEC: 4
ACC: 4
WCC: 3
Atlantic 10: 3
American: 2
Mountain West: 2

Tuesday, February 18, 2020

Marquette's Non-Con Check-In

 Maryland is chasing a 1-seed | Photo by G Fiume - Getty Images

I'm going to use this edition of the S-Curve update to look back at Marquette's non-con opponents, what we said at the time, and where they are now. We'll go chronologically:

Loyola-Maryland Greyhounds (13-14, 5-9 in Patriot League)
NET: 245
kenpom: 262
What we said: "They should be right in the middle of a four-team dogfight for the Patriot League title, though Colgate will be the favorites. If they stay healthy, there is a realistic change for this to be a Quadrant 3 (NET ranking 76-160) game."
What they are: The downside is this team has virtually no chance of being a Quadrant 3 game anymore. However, what we said about health may be the reason. The Greyhounds were without starting center Santiago Aldama for the first 22 games of the season. Since he made his debut, they are 4-1 including a win this past weekend over Patriot League leader Colgate behind 22 points & 8 rebounds from Aldama. They could be a dark horse conference tourney pick.

Purdue Boilermakers (14-12, 7-8 in Big 10)
NET: 33
kenpom: 26
What we said: "I almost certainly think the T-Rank [8th preseason] above is too bullish. Most pundits have the Boilers as a top-half Big 10 team and it seems foolish to not expect them to make the NCAA Tournament. The question is still who will score."
What they are: Despite a mediocre record, the Boilers are still metric darlings and on the bubble for NCAA selection. Today's forecast has them out as 2 wins over .500 simply isn't good enough, but they are very close to being in. The problem has been consistent scoring -- no one is averaging more than Trevion Williams' 11.0 ppg.

UW-Madison Badgers (15-10, 8-6 in Big 10)
NET: 31
kenpom: 28
What we said: "The most likely scenario is a team that is situated right on the bubble throughout the season. Marquette fans should feel cautiously optimistic going into this game. Without Happ, this won't be the same UW-Madison team, but Greg Gard still boasts a .763 winning percentage at the Kohl Center, and visitor wins there rarely come easy."
What they are: After a rocky start, the Badgers are on the right side of the bubble. Nate Reuvers has emerged as an Ethan Happ-lite and a stingy defense and home court has been enough to keep up their mostly winning ways. And while Marquette fans were optimistic heading to the Kohl Center, it's safe to say that day's loss has proven to be more consistent with what this Badger team has become, as they are 11-1 at home this year.

Robert Morris Colonials (15-12, 11-3 in Northeast)
NET: 220
kenpom: 214
What we said: "They have the top-of-the-roster quality and overall depth to be one of the best teams in their league. Is it enough to pull off an upset in Milwaukee? Not likely, but this will likely be a top-half of Quadrant 4 game."
What they are: While RMU is second in the NEC, league leader Merrimack is NCAA Tournament ineligible, so the Colonials are trending toward the 1-seed. They have a huge game at St. Francis (PA) tonight that could decide the team that plays all NEC Tournament games on their home court. The top-half of Q4 prediction looks dead on.

Davidson Wildcats (13-11, 7-5 in A-10)
NET: 78
kenpom: 67
What we said: "This is a team that is going to win 20+ games, has a legit shot at winning their conference, and should be at least in the mix for an at-large berth come Selection Sunday."
What they are: Can we have a do-over on this one? While the Wildcats gave Marquette fits for 35 minutes before Markus Howard finished them off, they never got going and are the most disappointing team on Marquette's non-con schedule in terms of missing expectations. They have trended up of late, but it seems unlikely this will reach the Quadrant 1 status we hoped for before the season.

USC Trojans (19-7, 8-5 in Pac-12)
NET: 49
kenpom: 55
What we said: "Their raw talent will earn them wins but they are projected almost across the board as a middle of the pack Pac-12 team. If it all comes together, they could challenge for an at-large bid, but while they will almost certainly win their first round Advocare matchup with Fairfield, this is a team that Marquette should beat."
What they are: USC is a middle-of-the-pack Pac-12 team, but the league is so logjammed that they are also just one game out of first. Onyeka Okongwu has been a beast, helping this team to challenge for that at-large bid we expected (currently projected in). They did indeed beat Fairfield before falling to Marquette behind Markus Howard's 51-point performance.

Maryland Terrapins (21-4, 11-3 Big 10)
NET: 7
kenpom: 8
What we said: "On paper, they are the best team Marquette could see in the non-conference, but pundits may be underestimating how important Fernando was on both ends of the floor. They will overwhelm some teams with sheer talent, but when it comes to other deep, high-major rosters, someone will have to emerge as a star."
What they are: They are the best team Marquette saw in the non-conference on the court, too. Largely because Jalen Smith is trending towards All-American status and Anthony Cowan has been a stud as a senior. They hammered Marquette in Orlando and are probably the best bet to steal a 1-seed if anyone ahead of them slips thanks to gaudy Q1 numbers and opportunities.

Jacksonville Dolphins (12-15, 5-7 Atlantic Sun)
NET: 250
kenpom: 231
What we said: "Jacksonville is one of the two teams on the schedule that are effectively duds. They are a bottom-half of the Atlantic Sun team and will almost certainly be fighting to stay in the top-300 of NET."
What they are: The Dolphins haven't been great, but have been better than expected. They are right in the middle of the A-Sun and safely inside the top-300 in NET. They aren't a help to Marquette's resume, but are certainly better than some of the lower quality buys we've seen in the past.

Kansas State Wildcats (9-16, 2-10 Big 12)
NET: 95
kenpom: 96
What we said: "To me, K-State feels like a team that is about to fall sharply. Weber has struggled for consistency and his most notable achievement in Manhattan was largely due to benefiting from playing a 16-seed in the second round. They should still be a good defensive team, but I don't think they will be as good as they were last year...Projections have them as a bubble team, but they look more like a NIT team that lacks the firepower to compete for a NCAA bid."
What they are: The Wildcats definitely fell off sharply. They are at the bottom of the Big 12 and seem unlikely to even qualify as a Quadrant 1 road win (top-75). The defense has been better than the offense, but not close to Weber's past teams. Barring a miracle run in the Big 12 Tournament, their only chance of playing in the postseason is if they are paying to for the privilege.

Grambling State Tigers (13-13, 7-6 SWAC)
NET: 305
kenpom: 310
What we said: "As stunning as this is to say, Grambling is going to be good. It might only be "for the SWAC" good, but considering what this program has been for the past 15 years, that is an accomplishment."
What they are: This team definitely has not delivered. We were hoping for a run at the SWAC title, but after a 3-0 league start, they've sputtered, including losing their last two games at league leaders PVAMU and Texas Southern. They are better than the sub-350 RPI Grambling teams of the past, but are still a dud compared to what their roster projected to be in the preseason.

North Dakota State Bison (19-7, 10-2 Summit League)
NET: 131
kenpom: 122
What we said: "The Bison showed promise last year and the table is set for them to win their league and return to the NCAA Tournament. In 5 seasons, Dave Richman has 4 campaigns with 19+ wins and should be confident his team can repeat that feat this year...this is a high-ceiling team that should be a Quadrant 3 opportunity."
What they are: This one we pegged perfectly. The Bison are tied atop the loss column and have already won 19 games while establishing themselves as a Quadrant 3 win for Marquette. They will be one of the favorites to get to the NCAA Tournament from the Summit.

Central Arkansas Bears (9-17, 8-7 Southland)
NET: 309
kenpom: 272
What we said: "I expect them to finish over .500 in league play and contend for a top-half finish. While they will likely be one of the low points on the schedule, when the worst opponents on your schedule look like NET 250-275 opponents, it's a lot better than the 3 average sub-300 opponents MU has faced in Wojo's first 5 seasons."
What they are: The predictive metrics like UCA better than NET, where they are indeed a sub-300 team. They have been unlucky this year, losing 4 games in overtime and another by 1-point to Duke-killers Stephen F Austin. At this point, their ceiling is probably finishing just inside the top-300. 

Let's check out the S-Curve:

1-Seeds: 1-BAYLOR 2-Kansas 3-GONZAGA 4-SAN DIEGO STATE
2-Seeds: 8-Villanova 7-DAYTON 6-DUKE 5-MARYLAND
3-Seeds: 9-Florida State 10-AUBURN 11-SETON HALL 12-Creighton
4-Seeds: 16-Penn State 15-OREGON 14-Kentucky 13-Louisville
5-Seeds: 17-West Virginia 18-Butler 19-Marquette 20-Colorado
6-Seeds: 24- Michigan 23-Michigan State 22-Iowa 21-Ohio State
7-Seeds: 25-Arizona 26-Lsu 27-Wisconsin 28-Byu
8-Seeds: 32-Rutgers 31-HOUSTON 30-Xavier 29-Illinois
9-Seeds: 33-Texas Tech 34-Georgetown 35-Oklahoma 36-Arizona State
10-Seeds: 40-St. Mary's 39-Wichita State 38-Rhode Island 37-Usc
11-Seeds: 41-NORTHERN IOWA 42-Florida 43-Virginia 44-East Tennessee State/45-Richmond
12-Seeds: 50-VERMONT 49-YALE 48-FURMAN 47-Indiana/46-Utah State
13-Seeds: 51-WRIGHT STATE 52-STEPHEN F AUSTIN 53-NEW MEXICO STATE 54-NORTH TEXAS
14-Seeds: 58-LITTLE ROCK 57-UC IRVINE 56-COLGATE 55-HOFSTRA
15-Seeds: 59-AUSTIN PEAY 60-SOUTH DAKOTA STATE 61-WINTHROP 62-MONTANA
16-Seeds: 68-NORFOLK STATE/67-ROBERT MORRIS 66-PVAMU/65-ST. PETER'S 64-NORTH FLORIDA 63-BOWLING GREEN

Last Four Byes: Wichita State, St. Mary's, Florida, Virginia
Last Four In: East Tennessee State, Richmond, Utah State, Indiana

NIT 1-Seeds: Cincinnati, Arkansas, Alabama, VCU
NIT 2-Seeds: Stanford, UNC-Greensboro, Mississippi State, NC State

Multibid Leagues 
Big 10: 10
Big East: 7
Big 12: 5
Pac 12: 5
SEC: 4
ACC: 4
WCC: 3
A-10: 3
American: 2
Southern: 2
Mountain West: 2

Monday, February 17, 2020

It's revenge week

It feels like forever since #mubb played but we're here to talk about it and look ahead to a critical week. First, we talk about the results of the Villanova game and why while it wasn't good, it wasn't devastating either. That leads to a discussion of where the Big East stands and how MU might fit in the evolving puzzle of who's on top in the conference. We then talk about Markus Howard, #UsageGod and the #PORPAGATU stat. That ends up in a rather length Howard vs Powell discussion where we try to walk some people back from the Powell is terrible ledge. Lastly, we talk about games this week with two very critical games against Creighton and at Providence, both of whom have already beaten MU. For a light week, we have a lot to talk about. Enjoy! https://scrambledeggs.podbean.com/mf/play/z3n93q/scrambledeggs_edit_021620.mp3

Sunday, February 16, 2020

Why Markus Howard is Not (Yet) the NPOY Favorite

Howard was the 2019 Big East Player of the Year | Photo from Big East

We've now examined all the data. Howard's historical season scoring prowess is on par with past National Players of the Year like Glenn Robinson, Kevin Durant, and Doug McDermott. His career scoring is in line with the accomplishments of past National Players of the Year like J.J. Redick and Tyler Hansbrough. His PORPAGATU! score and ranking, which has been the best indicator of NPOY winners since its inception, is similar to past National Players of the Year like Buddy Hield, Frank Mason III, and Zion Williamson. And the most common criticisms of Howard are actually strengths that his critics refuse to acknowledge because they haven't examined his improvement since his freshman year.

So what is it that is keeping Markus Howard from being the clear choice with media members? It's very simple. Marquette only just entered the AP rankings for the first time this season. Here are the current AP rankings of all the NPOY candidates teams as well as their consensus projected NCAA seed according to bracketmatrix.com:

Player Team AP Ranking Consensus Seed
Devon Dotson Kansas 3 1
Malachi Flynn San Diego State 4 1
Jordan Nwora Louisville 5 2
Obi Toppin Dayton 6 2
Vernon Carey Duke 7 2
Myles Powell Seton Hall 10 3
Payton Pritchard Oregon 17 4
Markus Howard Marquette 18 6
Luka Garza Iowa 21 6
Cassius Winston Michigan State UR 5

That's it right there. When Mark Titus asks "why are only MU fans nuts about Howard then? What's the conspiracy?" we have an answer. If Markus Howard was averaging 27.9 ppg for a Marquette team that had been in the top-10 all year and was a consensus top-3 seed in the NCAA Tournament, he would absolutely, unquestionably be running away with the NPOY award the same way Zion Williamson did last year.

Gary Parrish from the Eye on College Basketball podcast | Photo from CBS Sports

Back on Friday, November 15, 2018, Gary Parrish and Matt Norlander were discussing their weekend picks and they had this exchange:

Parrish: Last game, Number 12 Seton Hall...
Norlander: WHAT?!? That's the game you're picking? <Incredulous> That's the game you're picking.
Parrish: Number 12 Seton Hall at St. Louis?
Norlander: Yeah. Why would you pick that game?
Parrish: SLU?
Norlander: No, why would you not take Marquette at Wisconsin?
Parrish: I don't even think I saw it...
Norlander: Oh my gosh, that's OBVIOUSLY the better game. Whatever. You've already, you've already picked the game. Just so people know, Marquette at Wisconsin, 1:00 on Sunday, it's the best game.
Parrish: It is, yes. I see it now.
Norlander: But you've already made your decision, Seton Hall at St. Louis is what we're riding with.
Parrish: Seton Hall at St. Louis, how did I miss Marquette at Wisconsin? This is the problem, when neither one of these teams that should be, that could be ranked in different seasons aren't ranked it gets off your radar a little bit. Which is another reason why, when people say the rankings don't matter, they DO matter, if one of these teams was ranked I would notice the game. Because neither is, I didn't even know it was happening.

The thing that has most harmed Howard's NPOY bid this year is Marquette's team performances in games where they were on the verge of being ranked and lost. Marquette has failed to seal the deal in three games this year (at Wisconsin, Maryland, at Butler) where they would've climbed into the rankings had they won. Their inability to do that has kept Howard out of the spotlight he deserves, reduced the time national media types like Titus and Parrish spend talking about his accomplishments, and increased the likelihood that when Howard was repeatedly willing Marquette to victories with mammoth scoring nights, voter eyes were focused elsewhere.

This week, Marquette climbed into the AP and Coaches' Polls for the first time this season. Ultimately that attention they garner and the seed Marquette earns will determine if Howard is able to capture the NPOY award he so clearly deserves. Let's look at the seeds of NPOY winners over the past 15 years:

Player Team NCAA Seed Year
Zion Williamson Duke 1 2018-19
Jalen Brunson Villanova 1 2017-18
Frank Mason III Kansas 1 2016-17
Buddy Hield Oklahoma 2 2015-16
Frank Kaminsky Wisconsin 1 2014-15
Doug McDermott Creighton 3 2013-14
Trey Burke Michigan 4 2012-13
Anthony Davis Kentucky 1 2011-12
Jimmer Fredette BYU 3 2010-11
Evan Turner Ohio State 2 2009-10
Blake Griffin Oklahoma 2 2008-09
Tyler Hansbrough North Carolina 1 2007-08
Kevin Durant Texas 4 2006-07
J.J. Redick Duke 1 2005-06
Andrew Bogut Utah 6 2004-05

Every NPOY winner came from a single-digit seed. Frankly, if Marquette is a 6-seed or better, Howard should be the winner, but even if they get up to the 4 line the award should go to Howard. The reason for that is simple. First, we already established that based on PORPAGATU! players like Carey, Powell, Nwora, Toppin, Winston, Flynn, and even Dotson would be historically poor choices for the award. That represents every player on the top three seed lines.

Getting ranked was easier for Marquette a year ago | Photo by Dylan Buell - Getty Images

Howard's scoring when considered historically and his PORPAGATU! score means that if things are relatively equal between him, Pritchard, and Garza (the only other viable candidates) then Howard is the most deserving of the NPOY award. To get there, Marquette needs to do two things:

1) Stay ranked: With Marquette being ranked, their presence in games will be enough that the national media personnel who drive the narrative will discuss the team's success. The good news is Marquette is favored (according to Pomeroy) in all six of their remaining games. The bad news is five of those projected wins are by just one possession, so essentially Marquette has to win their 50/50 games to maintain or improve their ranking & keep attention on their star.
2) Earn a single-digit NCAA seed: Right now, Marquette is forecast as the first 6-seed on bracketmatrix.com, just three spots ahead of Luka Garza's Iowa. In a year where the players on the top three seed lines simply are not worthy of the NPOY award, Marquette getting to the 5-line should be enough and earning a 4-seed or better should absolutely make Howard the unquestioned lock to win the NPOY award. But Marquette has to win the games to earn that seed.

And that's it. Win games, get ranked, earn a good seed, and Markus Howard, who is already the obvious NPOY winner based on merit and numbers, will draw the attention he needs to win the award that should already be his.

TL;DR Version:

  • Markus Howard hasn't received the attention he deserves because Marquette has been unranked all season.
  • As Gary Parrish says, "when people say the rankings don't matter, they DO matter."
  • If Marquette earns a 6-seed or better, Howard should win the NPOY award.
  • For Howard to win NPOY, Marquette needs to stay ranked and earn the highest seed they can.