Photo by Morry Gash | AP Photo
Starting at Christmas, I publish bracketology article here 1-2 times per week. When I do, I always try to include something more than just a seed list, whether it's focusing on Marquette's outlook (this is an MU blog, after all), the state of the Big East, or something further flung like the Big 12's chase to 8 bids. This week, I decided to focus on the step-by-step process I use in building out these articles. If you just want the results, scroll down. If you're wondering how we got there, this text is for you.
1) NET & the Automatic Bids
Most bracketologists use the current conference standings for the autobid. I used to do that, but ran into debates when teams were tied at the top or a weak 1-0 team went ahead of a metrically stronger 1-1 team. To pick my Automatic bids, I take the highest conference NET rank. Over the years, we have seen through results that NET is largely a predictive metric like kenpom or Sagarin. While conference records determine conference tournament seeding, a predictive metric is better designed to identify that conference tournament winner. Since the NET is the NCAA's official evaluation tool, I feel it's a better metric than conference record to determine who the auto-bid should be ahead of conference tournament time.
2) Build the Spreadsheet
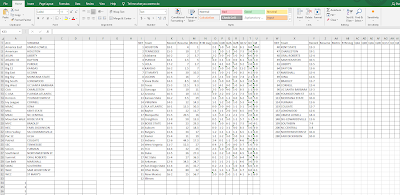
Ultimately, my goal is to sort teams into groups, then order those groups. To do that, I build a spreadsheet. The first spreadsheet has space for all of the 32 Automatic bids on the far right, the bottom 22 Automatic bid resume lines on the far left, room for all considered at-large resumes and the top 10 Automatic bid resumes in the middle, then 36 at-large selection boxes and the eventual seed list at the bottom. I use a stock template and fill it in manually every time. The information assigned to each team includes their NET ranking, overall Record, the average of their Resume metrics (KPI & SOR), the average of their Predictive metrics (BPI, Kenpom, Sagarin), the Average of those Averages (which is the best seed line predictor), and records against each of the Quadrants. Here's what it looks like as it's being built:
3) Select the At-Large Teams
On Selection Sunday, selecting the 68 teams and seeding them are separate steps for the Committee. Typically, Selection is based more on NET and the Resume Metrics. Generally, any high-major team in the top-20 of NET automatically goes into the field. After that, I focus more on the Resume Metric Average and compare resumes. Most teams in the top-35 are pretty safe. I'm also focusing heavily on Q1 wins and Q1+2 records. The reason for this is the Selection Committee has shown they value who you beat far more than who you lose to (see: 2016 Tulsa, 2019 Arizona State, 2022 Rutgers, etc). This is pretty straight forward down to the 32nd at-large.
4) Select the Bubble
The first 32 at-large teams will be seeded with the 10 highest placed auto-bids, but the last four teams I select remain in the First Four 11-seed games. Because of how seeding works, teams can jump somewhat dramatically (by a line or two) when they get out of the First Four. We'll look at that with Indiana and Creighton later. Our last four in were Northwestern, Oklahoma, West Virginia, and Maryland. Typically teams that are below 52.5 in the Resume Average get left out. Rutgers was an exception last year, but none of our selections today are. Teams like Seton Hall and Mississippi State were knocked out because of that. Quadrant 1 wins matter. Our "Last Four" all have multiple Quadrant 1 wins, something teams like Kentucky, USC, and UCF cannot claim. Our last team in was Maryland. Why the Terps? It came down to them or Wake Forest, and Maryland is better in the NET, better in 4/5 Team Sheet metrics, and has done that against a tougher SOS. Now we move to seeding.
5) Seed Lines 12-16
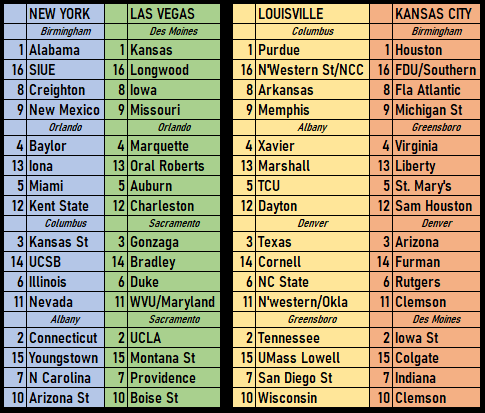
Traditionally, the 12-16 seed lines feature the bottom 22 automatic bids. On occasion there might be a play-in game in this range (2012 BYU/Iona, 2022 Indiana/Wyoming) but that's a rare occurrence. As mentioned before the average of the Resume and Predictive (RAP Score) metrics is the best seeding predictor. In this case, I start at the bottom and seed my way up to the top. Only a few rules apply. First, I never seed the HBCU conferences (MEAC & SWAC) into the same First Four game. As I go, I batch teams together. Four teams with sub-190 RAP scores? There's the First Four. Three teams from 144-148? That requires a bit more subjective evaluation. At the top of these 22 teams, we have Charleston. There's been some Charleston/FAU discussion nationally, but they aren't close when it comes to seeding. FAU is 32 spots ahead in NET, has better Resume and Predictive (by 29.4!) averages, and 2 Q1 wins to zero. FAU has the vastly superior resume in every possible way. Here's the 12-16 field as I was selecting the last 16-seed, which went to Longwood after also considering UMass-Lowell and Montana State:
6) Seed Lines 1-11
I do this in the opposite order, starting with the 1-seeds and working my way down. The same process follows, with RAP score and Quadrant records the main focus, though here I tend to dig closer into actual results. This is especially true when it comes to teams that are close. So for instance, at the end of the 4-line, I had to decide between Marquette and Auburn. I knew two of the teams would be 4-seeds and the last would be a 5. Metrically, Auburn is the "best" at a 15.15 RAP score, but Marquette (18.25) was close. In addition, while Auburn has the better overall record (15-3 vs 15-5) and Q1+2 record (8-3 to 7-5), Marquette has three Quadrant 1 wins including one in Q1A (elite opposition) while Auburn has just one in Q1B. As a result, Marquette took the 4-seed.
Recency bias should also not play a factor. The Selection Committee takes the season as a whole, so when a team like UConn starts losing, there's a limit to how far they should fall. The Huskies have lost five of six, but when you compare their best wins (#3 Alabama & #9 Iowa State, both on a neutral) no one else can match that. They do have a Q3 loss, but so do Gonzaga and Xavier in the protected seeds. The four teams on the 3-line (Gonzaga, Texas, Arizona, K-State) have just one combined top-9 win away from home. As good as their overall resumes are, and as hot as K-State is at the moment, the overall resume still isn't as good as UConn.
Finally, it's important to ignore your own recency bias. Indiana and Creighton were among the last teams I selected that weren't in the First Four, coming in with a batch that included Arkansas and Pittsburgh. But when it comes to seeding, you start over. Despite being in the 38-41 range of overall selection (behind 28 at-large teams and 9 auto-bids) their RAP scores come in at #27 and #28 in terms of the final field. This leads to Indiana being on the 7-line and Creighton on the 8-line as opposed to the 10/11 lines where their initial selection might indicate.
7) Place Seeds Into the Bracket
The first teams that get seeded are the protected seeds, in order. So each of the 1-seeds is placed in the closest region to their campus, and the closest first weekend site. Generally, I try to keep teams in column order (so the strongest 1-seed, Houston, gets the weakest 2-seed, Iowa State) but this can get difficult when teams have to be kept apart due to league affiliation. No protected seeds from the same conference are supposed to fall in the same region, but this becomes impossible when you have 5 Big 12 teams in the top-16 and four regions. As a result, Baylor and Kansas State both went to the East.
After seeding these, I draw their opponents, avoiding rematches from the current season and the most recent NCAA Tournament. I also try to avoid giving a geographic disadvantage to any of the top-16 teams. The Top-16 line up easily with the 13-16 lines so there are rarely conflicts that can't be easily fixed.
It gets trickier in the 5 through 12 lines. There is more potential for conference foes to be drawn close. By and large, the rule is conference opponents don't meet in the first round, teams that have played each other once in the regular season can't play until the second round, teams that played each other twice can't meet until the Sweet 16, and teams that played three times can't play until the Elite 8. This is where you sometimes have to get creative and might even have to move a team up or down a line to avoid such situations. That was not the case with this bracket.
Here is our updated S-Curve and bracket:
Last Four Byes: Wisconsin, Clemson, Pittsburgh, Nevada
Last Four In: Northwestern, Oklahoma, West Virginia, Maryland
NIT 1-Seeds/First Four Out: Wake Forest, Penn State, Kentucky, USC
NIT 2-Seeds/Next Four Out: UCF, Seton Hall, Mississippi State, Texas A&M
Multibid Leagues
Big 10: 9
Big 12: 8
ACC: 7
Big East: 5
SEC: 5
MWC: 4
Pac-12: 3
American: 2
WCC: 2


No comments:
Post a Comment